It’s an oh-so-familiar scenario. Your organization is embracing a “cloud first” initiative, and you are part of the engineering team that is responsible for supporting the new hybrid environment. It’s Friday afternoon; you’re heading home, and you are hoping for a quiet weekend and a smooth transition to the next on-call engineer Monday morning. This week’s migration of your on-prem point of sales (POS) application to your new cloud environment went well, and you have not received any complaints from the app team. Fast forward to 3 a.m. local time Monday morning, and you are awakened by an on-call page alerting you that the batch processing service for your newly migrated POS application is not functioning properly. Your ability to successfully respond to this situation will hinge greatly upon your application performance monitoring strategy. With the correct APM tools and strategy, you will be able to quickly identify the root cause of the problem and make the necessary changes. More importantly, with the correct APM tools and strategy, you may have been able to identify the problem area before it caused an outage.
What is Application Performance Monitoring (APM)?
We are all aware of the need to monitor the health of applications, but exactly what is Application Performance Monitoring (APM)? Application performance monitoring is the process of observing, collecting, and analyzing data regarding an application’s technical performance, user-perceived performance, and the application’s availability. For those of you who like to get straight to the point, APM is identifying potential problems before they cause an outage and quick alerting and response in the case that an outage does happen. Application monitoring can be an intimidating task but collecting critical metrics, and smart alerting is a must in any organization. Out of all the tools I’ve used in my career, Dynatrace offered the most comprehensive solution for both on-prem and cloud-native applications.
What is Dynatrace, and how does it help me?
Dynatrace is an AI-Powered observability platform. You can use Dynatrace to address the challenges of infrastructure monitoring, application performance, and application security. If you’re part of a DevOps team, DevSecOps team, cloud operations, or any team that has been tasked with supporting and monitoring an application and/or the supporting infrastructure, you can leverage Dynatrace to gain observability into your organization’s environment.
Observability
With the popularity of cloud computing, microservices, and distributed systems, many engineers find themselves presented with the unique day 2 operation challenges faced when supporting multi-layered architectures that usually span both on-premise and cloud environments. There are 3 pillars of observability: logs, metrics, and traces. With a complex multi-layered architecture, traditional log analysis simply isn’t enough. Being able to get real-time data analysis of application performance and potential incidents will allow you and your team to proactively implement changes to prevent an outage and usually clear pending technical debt. Dynatrace is a platform solution that is robust and has a ton of useful features, but, for me, there were 3 components that were major selling points. The key features are OneAgent, PurePath, and Smartscape.
OneAgent
OneAgent is responsible for collecting all monitoring data within your monitored environment. A single OneAgent per host is required to collect all relevant monitoring data—even if your hosts are deployed within Docker containers, microservices architectures, or cloud-based infrastructure.
A single instance of OneAgent can monitor a complex environment which may include servers, applications, containerized services, databases, and more. OneAgent gives you all the operational and business performance metrics you need from your environment, including front-end and back-end processes. This includes cloud instances, on-prem hosts, network health, legacy processes, and services. OneAgent discovers all the processes you have running on your hosts. Based on what it finds, OneAgent automatically activates instrumentation specifically for your unique application stack. It also injects all tags required for user-experience monitoring into the HTML of your application pages. New components are auto-instrumented dynamically.
OneAgent consists of several code modules that enable OneAgent to work for most technologies out of the box. To identify the root cause of problems, Dynatrace uses all the OneAgent-delivered context information—such as topology, transaction, and code-level information—to identify events that share the root cause. Using all available context information, Dynatrace can pinpoint the root cause of problems in your application delivery chain and dramatically reduce the alert spam for single incidences that originate from the same root cause.
PurePath
PurePath is Dynatrace’s distributed tracing feature. PurePath provides extremely granular data insights via topology information, metadata, and code-level visibility. One of the things that helped with my analysis was the automatic baselining that Dynatrace provided. PurePath traces are key to effectively identifying bottlenecks, misconfigurations, and other landmines waiting to explode the next time you’re the on-call. PurePath and OneAgent will enable you to perform detailed error analysis and gain immense insight into your application and infrastructure.
Smartscape
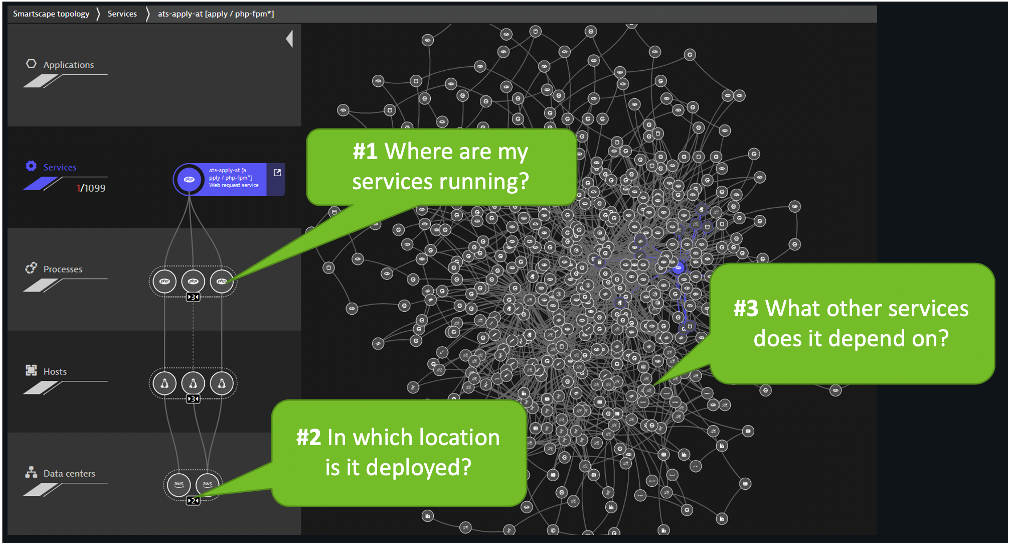
Smartscape auto-discovery delivers a quick and efficient visualization of all the topological dependencies in your infrastructure, processes, and services:
- On the vertical axis, it displays full-stack dependencies across all tiers
- On the horizontal axis, it visualizes all ingoing and outgoing call relationships within each tier
With just a few clicks, Smartscape gives you access to a detailed topological view of your entire environment, giving you more insight into and control over your environment.
- Make better decisions, such as adjusting your service architecture or infrastructure to improve application performance.
- Examine cross-tier and same-tier process, host, and service interdependencies to better understand how dependencies affect the performance of your applications.
- Drill down to gain a clearer insight into problems. For example, Dynatrace might identify an issue with third-party dependencies and help you understand the impact of the issue on your application’s performance.
That’s all, folks!
Whether you are a seasoned SRE or someone who is new to the DevOps space, everyone tasked with application and infrastructure support will sooner or later have to face the challenges of application monitoring and observability. There are a lot of tools that have some great features and served me well, but Dynatrace was the only tool that delivered the functionality that I needed to enable me to monitor and support both my on-prem workloads and cloud environment. Dynatrace is my clear winner for application performance monitoring.
If your organization is interested to learn more about Dynatrace or has any questions, then contact us.